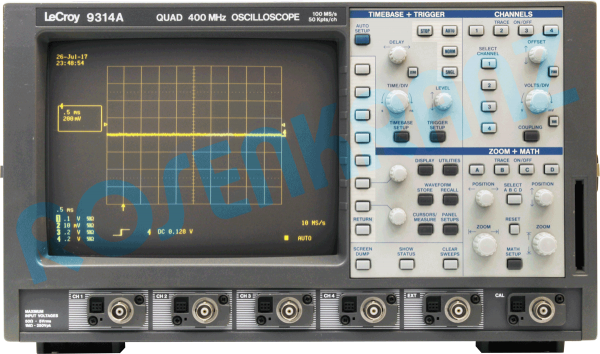
LeCroy 9314A
Available in the following models:
no options
Price on request
The LeCroy 9314A oscilloscope is a graph-displaying device it draws a graph of an electrical... more
Product information "LeCroy 9314A"
The LeCroy 9314A oscilloscope is a graph-displaying device it draws a graph of an electrical signal. In most applications,
the graph shows how signals change over time: the vertical (Y) axis represents voltage and the horizontal (X) axis represents time.
The intensity or brightness of the display is sometimes called the Z axis.
The LeCroy 9314A oscilloscope's simple graph can tell you many things about a signal, such as:
the time and voltage values of a signal
the frequency of an oscillating signa
the “moving parts” of a circuit represented by the signal
the frequency with which a particular portion of the signal is occurring relative to, other portions,
whether or not a malfunctioning component is distorting the signal, how much of a signal is direct current (DC) or alternating current (AC)
and how much of the signal is noise and whether the noise is changing with time.
| Product Group | Oscilloscopes / Digital |
- Order number: 5EDB2E6B-7ACE-4107-8180-447B32F82A18
Data Sheet

LeCroy 9314A
Zusatzinformationen
400MHz,100MSa/s,2ch
400MHz,100MSa/s,2ch
Price on request
Prices incl. VAT plus shipping costs
Related links to "9314A"